KF Spotlight : Commodity Supercycle or a Mere Inflationary Reaction?

Executive summary
The past decade was characterized by large fluctuations in commodity prices. A boom in commodity prices until 2008 was followed by a steep decline during the height of the financial crisis. Since late 2021, prices of major groups of commodities – including energy, food, and base metals have risen to levels seen during the peak reached in 2008. Commodity price movements are typically more pronounced than those of manufactured goods and services. But for some commodities, the speed of recent price swings have been large by historical average. These commodity price movements present important policy challenges worldwide. In the near term, policymakers need to deal with the macroeconomic consequences of high and volatile commodity prices, including inflationary pressures and real income losses, which tend to be especially severe in lower-income commodity importing countries. Over the longer run, the key issue is to ensure that commodity supply growth keeps track with the needs of a growing and more integrated global economy. Meeting this challenge is a precondition for sustained improvements in economic and social welfare worldwide.
The focus area of this report has been on the energy sector in which WTI & Brent crude oil were reviewed as they have been the benchmark for the crude oil market. Both indices having seen all time high prices being recorded in Q1 2022 due to the Russia – Ukraine war. From the grains sector, the FCPO – crude palm oil was studied as it became the most expensive edible vegetable oil due to the supply disruption in the market and Indonesia’s regulations to the exports. From the industrial metal front, both LME Copper & Nickel were included in the review as this materials were major components in industrial manufacturing and particularly Nickel gaining headline as the priced soared above the USD 100,000 per tonne value. Lastly for the precious metal bracket, gold was included in this Q1 review as the start of this year saw the demand for the products increasing drastically in the retail market.
This report has been exclusively created by Kenanga Futures’s Business Development & Strategy team.
MARKET OVERVIEW
Frenzy trading and surging prices for natural resources – from iron ore and aluminum to edible oils and timber – had markets abuzz with conversation that the pandemic bounce-back might trigger a “supercycle” for global commodities. With global political leaders pouring recovery funds into infrastructure and clean energy projects, there were signs of a multi-year commodities boom that could stoke global finance and fuel inflation.
What is a commodity supercycle? Contrast to short-lived cycles created by supply shocks, a commodity supercycle is an extended period of strong demand growth that suppliers struggle to match; thus sparking a rally that could last for years or even decades. Supercycles tend to coincide with periods of rapid industrialization and urbanization, with the previous cycle being fueled by China’s rapid development after it joined the World Trade Organization in 2001.
While most markets have enjoyed strong rebound from the depths of Covid-19 crisis, commodity markets have been a frontrunner in the recovery. Commodity prices across the board are climbing at its fastest rate since 2020 underpinned by global economic rebound and improved growth prospects. The Bloomberg Commodity Index (BCOM) Index, a commodity index composed of 23 commodities across six physical commodities sector, is up 34.7% as of December 2021. Demand appears to be growing for almost all commodity markets, while supply is structurally constrained across the board. This benchmark index’s composition is lead by energy group at 29.8% followed by grains at 22.7%, precious and industrial metals group at 15.5% and 9.0% respectively. The softs market group holds 7.2% and livestock holds the least at 5.6% of the index.
BCOM Index Chart – 1995 to 2022
Index Points
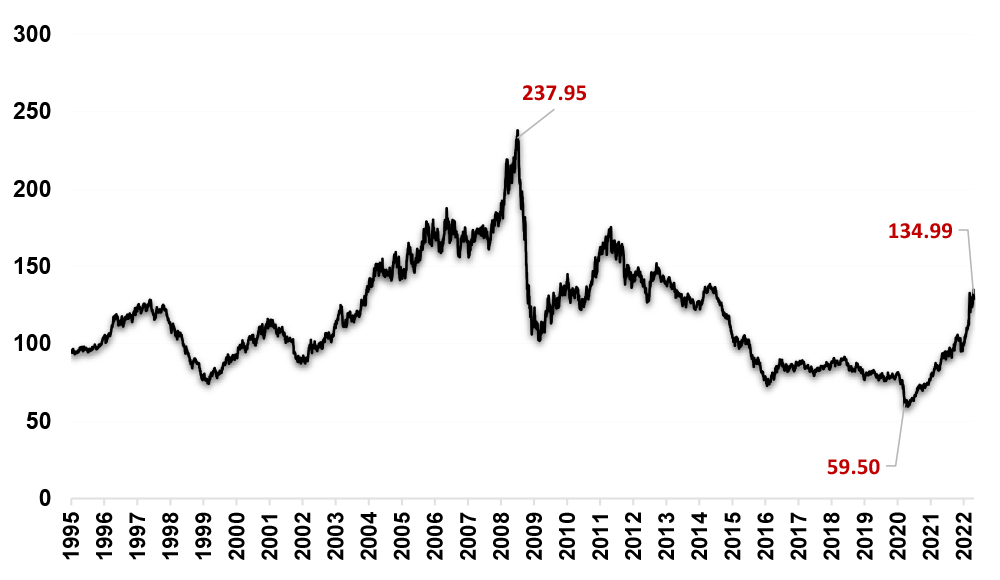
Source : Bloomberg
Note : Softs market group consist of sugar, coffee & cotton commodity
Growing tension between Russia and Ukraine has had profound implications for natural gas and other internationally traded edible oil prices. As the war escalates, natural gas markets are going through a period of heightened volatility as supply growth was not matching stronger-than-expected global demand. As the second largest commodity producer in the world, Russia’s invasion has serious implications not only to many countries, but also to the global supply chains.
Commodity Market Performance Growth (%) – YTD
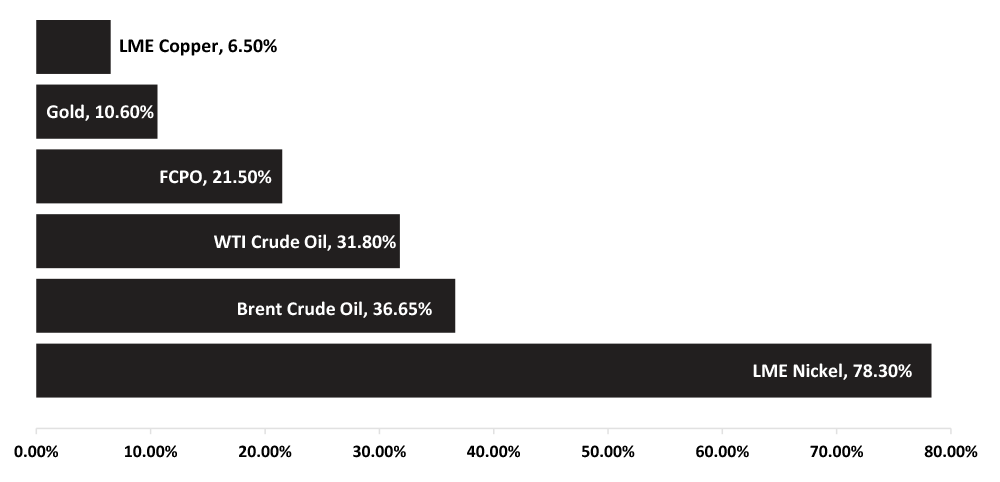
Oil prices have soared above US$130 a barrel on March 7th 2022 to hit their highest level in over a decade, while Gold has extended its rally from just under US$1,800 an ounce on 10th February 2022 to a high of US$2,043 an ounce 8th March 2022. The bullish momentum also spilled over to other commodities such as Aluminum, Platinum, Palladium, Copper, Zinc, Wheat, Coffee, Lumber & Nickel; with prices blasting through all-time highs in first quarter of 2022. In effect, Nickel prices has snatched the headlines with a blistering gain of over 250% in a single day — marking the biggest one-day fluctuation ever seen in the history of the commodity markets.
Geopolitical tension coupled with labor shortages have exacerbated pressure on the balance between supply and demand. The inability to recruit foreign workers due to the pandemic-led curfews have resulted in acute shortage of workers for the Malaysia plantation sector – impacting the harvesting and thereafter the supply of the edible oil. Sarawak, being the second largest palm oil producing state in Malaysia, faced a shortage of 45,000 foreign workers and this brought direct impact to the state’s palm oil production. To alleviate the situation, Malaysia signed a MOU on the 04th April with Indonesia and had already signed pre-agreements with Bangladesh in the 1st quarter to allow entry of the domestic workers which would aid the palm oil production companies.
Source : Bloomberg , Reuters, Trading Economics
The global commodity market has enjoyed an upward trend since 2000 to reach its peak of 237.95 in 2008, followed by a decade-long correction. Since the Covid-19 pandemic broke out in late 2019, the prices of most commodities have increased, which was evident in 2021 with the Index seen hitting a 2-year high of 134.99 in April 2022. As the market continues to climb higher in the first quarter of 2022, buoyed by global economy recovery and intensifying geo-political tension between Russia and Ukraine, it would be interesting to see if the current trend could sustain throughout the year and strive for another decade of bull run similar to 2008.
Talk of a commodity Supercycle is already heating up, but one should be mindful not to overreact to recent data as some commodities are notorious for fleeting booms and busts and typically need fundamental shifts in demand or supply to elevate prices for an extended period
FACTORS THAT AFFECTED THE MARKET
H1 2022

Source : The Guardian UK, Reuters
Russia – Ukraine Geopolitical Tension
Ongoing conflict has profound impact on food security and edible oil consumption for countries that heavily dependent on grain and other food imports. Ukraine and Russia jointly control 77% of world exports of sunflower oil, with Ukraine’s share being 48%. Commodity prices have seen their sharpest rises since 1970, causing prices of essential goods to surge upwards.
Markets have been trading at unprecedented levels, forcing some exchanges to suspend trading and raised margin requirements. London Metal Exchange (LME), for example, was forced to halt nickel trading and cancel their deals, after prices doubled to over US$100,000 a tonne within an hour.
The conflict has also overshadowed Asia, with rising commodity prices and weaker European demand for exports dragging on economies fighting to get back on track after Covid19-induced recession. Rising commodity prices have exacerbated general inflation pressures and further widened inequality gaps for many emerging and developing economies.

Source : KPMG
Logistics disruption
Ongoing global logistics disruptions stemming from pandemic-led curfews continue to impact businesses and consumers as the flow of consumer goods into key markets. North America, Europe, India China, and parts of Southeast Asia is affected by the continued shutdowns of major global ports and airports.
Logistics disruptions created a ripple effect across global supply chains resulting in piling up of goods in storage, disruption in port’s traffic; thereby restricting global trade flows and limiting imports and businesses ability to refill inventory.
Source : Economist, Forbes, CNBC
U.S tightening monetary policy in response to inflation
After a year of solid employment growth and strengthening economic data, the Federal Reserve (Fed) raised interest rates by 25bps in March 2022. That will bring the rate now into a range of 0.25%-0.5%. Along with the rate hikes, Fed indicated the possibility of six more rate hikes this year and three more in 2023. Global stock markets initially reacted negatively to the announcement but has since rebounded. Bond yields momentarily moved higher, with the benchmark 10-year Treasury note rising to 2.22% before receding.
To contain the economic fallout of the COVID-19 pandemic, the Federal Reserve (Fed) took a broad array of actions, including expansionary policy and quantitative easing. Throughout the pandemic outbreak, Fed has bought a staggering US$3.3 trillion in Treasuries and US$1.3 trillion in mortgage-backed securities as it sought to normalise its ultra-loose monetary policy and keep borrowing costs low.
Source : Reuters, Nikkei Asia Review, PWC China
Declining Growth Rate – China
Despite recording a 4.8% GDP growth in March 2022, China’s economy slowed sharply compared to its previous quarters resulting from property slowdown, a less favourable global backdrop for exports, and as its battle with Covid-19 outbreaks continues.
While the Russia-Ukraine conflict may not to pose any major risks to China’s growth outlook, it has pushed up import prices for key commodities, including oil. This coupled with recent surge in Covid-19 cases in Shanghai has impacted it’s economy and supply-chain movement globally.
The government continue to focus on its property market, with officials vowed to keep prices and market expectations stable, and adopt city-specific measures to ensure the sector’s sound development. International Monetary Fund on 19th April 2022 cut its growth forecast for China this year to 4.4%, well below Beijing’s target of around 5.5%, on the risks of widespread COVID-19 lockdowns and supply chain disruptions.
Commodity Market Review
H1 2022
COPPER
CME COPPER 2022 YTD Chart
USD per POUND
Copper is one of the oldest metals ever used and has been one of the important materials in the development of civilization. Because of its properties, singularly or in combination, of high ductility, malleability, and thermal and electrical conductivity, and its resistance to corrosion, copper has become a major industrial metal, ranking third after iron and aluminum in terms of quantities consumed.
Due to the COVID-19 pandemic, the global Copper market size is estimated to be worth over US$255 million in 2022, and is forecast to a readjusted size of US$343 million by 2028. Higher supplies and softer demand are expected to cool copper prices in 2023 with expectations of slower demand growth in China and rising supplies from operations such as Anglo American’s Quellaveco mine in Peru.
2022 may seems to be a deficit market owing to strong Chinese copper demand, despite the negative headlines. China’s stimulus and potentially strong post-Chinese New Year buying, against a backdrop of low inventories and an ability to ride out and even benefit from the inflation/fed tightening story, point to a sharp rally in the copper price to over US$5.40 per lb this year.
Source : Bloomberg & Chicago Mercantile Exchange (CME)
CME MICRO COPPER FUTURES – CONTRACT SPECIFICATIONS LAUNCHING ON 2nd MAY 2022!
CME Group, the world’s leading derivatives marketplace, announced that it will expand its suite of micro metals products with the launch of Micro Copper on May 2, 2022, pending regulatory review.
A micro-sized Copper contract will provide a variety of market participants, ranging from institutions to sophisticated individual traders, with greater access to the transparency and liquidity of CME Group’s Copper markets at a time of heighted economic uncertainty. Micro Copper futures will be one-tenth the size of a standard sized Copper futures contract and will be cash settled. The contract specification of the new product is as below :
| CONTRACT UNIT | 2500 pounds |
|---|---|
| PRICE QUOTATION | U.S. dollars and cents per pound |
| TRADING HOURS | CME Globex: Sunday 5:00 p.m. – Friday 4:00 p.m. CT CME ClearPort: |
| MINIMUM PRICE FLUCTUATION | 0.0005 per pound = $1.25 |
| PRODUCT CODE | CME Globex: MHG CME ClearPort: MHG Clearing: MHG |
| LISTED CONTRACTS | Monthly contracts listed for 23 consecutive months and any Mar, May, Jul, Sep, and Dec in the nearest 63 months. |
| SETTLEMENT | Financially Settled |
| TERMINATION OF TRADING | Trading terminates at 12:00 Noon CT on the third last business day of the contract month. |
| SETTLEMENT PROCEDURES | Copper Futures Settlement Procedures |
| POSITION LIMITS | COMEX Position Limits |
| BLOCK MINIMUM | Block Minimum Thresholds |
| PRICE LIMIT OR CIRCUIT | Price Limits |
Source : Chicago Mercantile Exchange (CME)
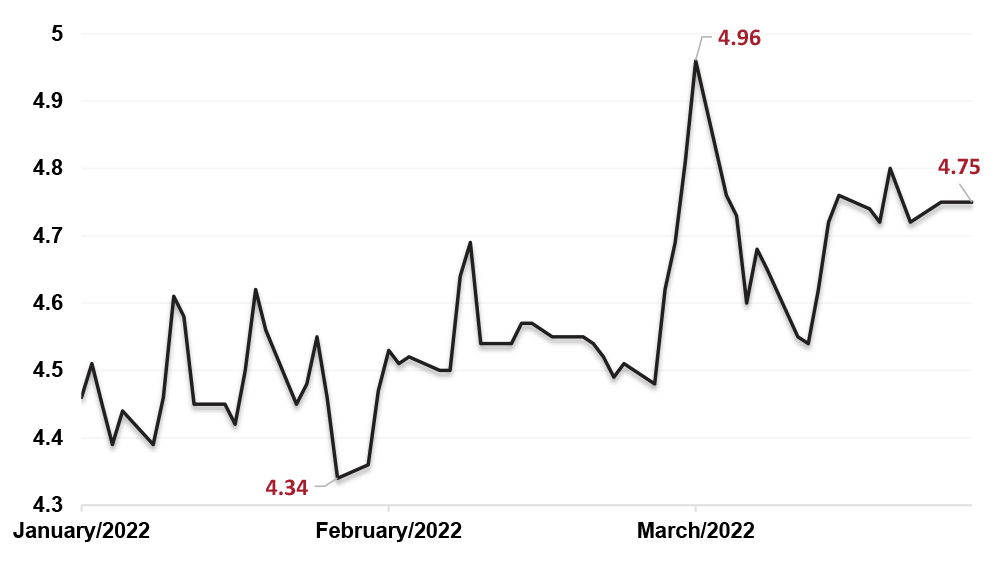
GOLD
GOLD 2022 YTD CHART
USD per OZ
Gold rose for the second consecutive quarter in Q1 2022, ending 8% higher at US$1,942 per oz, compared to it’s best quarterly performance since Q2 2020. It was among the best performing asset class amid significant weakness in both equity and bond markets. In a period marked by heightened economic uncertainty and increased volatility, gold has proven to be a reliable source of diversification and wealth preservation.
The outlook from World Gold Council’s quarterly commentary was inline with expectation for the competing forces of higher, more persistent inflationary pressure and rising interest rates to be the biggest influences on gold’s performance. The Russia–Ukraine war added an additional layer to this, as investors sought high-quality safe havens like gold amid equity market volatility and compounding unanticipated inflation pressures, including record oil prices.
Regional insights from major player in the gold market showed that China was weighing on local gold consumption in March 2022. This was also reflected in a compression of the spread between the local and international price of gold during the month and showed that Chinese gold ETF holdings rose over the same period to a record high in terms of tonnage at a price of 72.4 / tonne. Whereas in India, retail demand remained sluggish during March 2022 as buyers postponed purchases in anticipation of a correction in local gold prices.
Source : World Gold Council
WTI & Brent Crude Oil
WTI & BRENT CRUDE OIL 2022 YTD CHART
USD per barrel
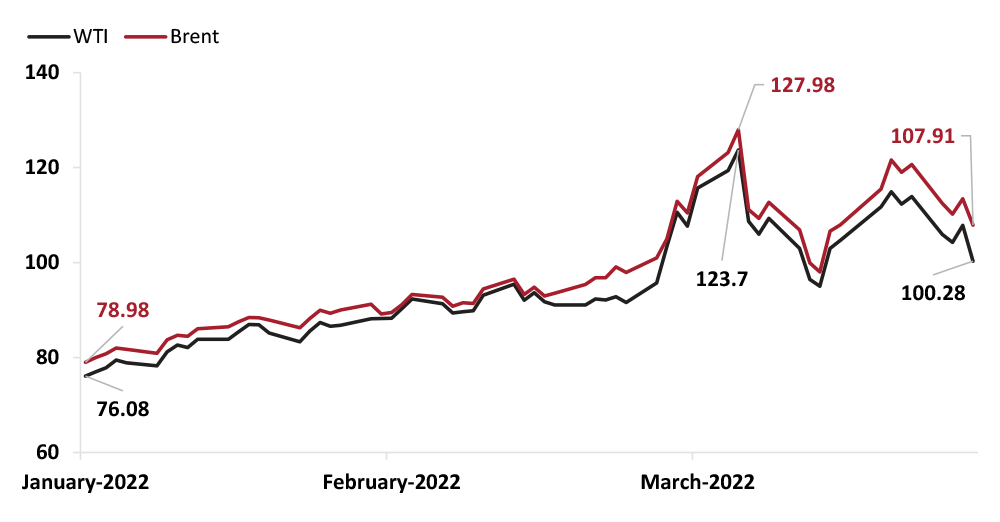
Crude oil prices in Q1 2022 were subject to a wide range of price pressures and sustained price volatility throughout most of the quarter. Russia’s further invasion of Ukraine, which began on February 24, as well as trade disruptions, sanctions, and businesses pulling out from Russia continued to contribute to substantial uncertainty in petroleum markets in the first quarter of 2022. The conflict between Russia and Ukraine has increased crude oil prices to soar above US$100 per barrel February and March 2022.
President Biden announced on 8th March 2022 that the United States would ban imports of oil, liquefied natural gas, and coal from Russia. Similarly, United Kingdom announced that it will phase out imports of oil from Russia over the course of 2022, and the European Union announced a plan to significantly reduce the amount of fossil fuels that Europe imports from Russia before 2030.
Several international oil companies announced plans to stop their operations in Russia and end partnerships with Russian firms, which could limit future crude oil production in Russia. These new developments could put additional upward pressure on crude oil prices.
Also, there were substantial supply-side uncertainty in the first quarter of 2022. City-scale mobility restrictions in China, which began in early March, to combat surging Covid-19 cases has further contributed to heightened demand-side risks and downward pressure on crude oil prices during the month.
Source : U.S Energy Information Administration (EIA)
NICKEL
LME NICKEL 2022 YTD CHART
USD per tonne
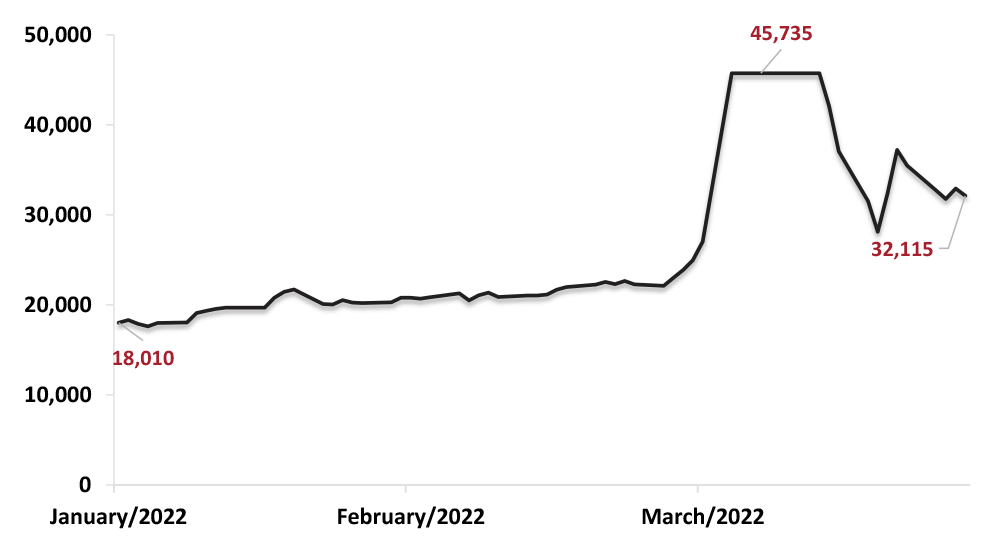
Nickel, a metal used in stainless steel and electric-vehicle batteries, has been at the center of the fallout from the Ukraine war and the West’s sanctions on Russia who are the third-largest producer of nickel, and sources 17% of the world’s high-purity supply. Sanctions imposed on the country over its invasion of Ukraine have spooked an already tight market.
The eye-popping surge in global nickel prices on March 8 has left the international community baffled. Prices of nickel, known for its use in several green technologies, surged more than 100% to over US$100,000 per tonne on March 8th after an over 60% move on the day before.
The move is likely to be a function of a massive short-covering by traders who were holding bearish positions on the commodity as prices surged dogged by the fears of supplies being hit by sanctions on the Russian economy for its assault on Ukraine. According to Bloomberg, the short positions were held by Xiang Guangda’ s company, Tsingshan Holding Group which bought significant amounts of nickel to cover short positions. Tsingshan, the world’s largest nickel producer, kept buying even as the metal’s price rose to prevent further potential losses, driving the price even higher. The extreme volatility prompted the London Metal Exchange to suspend nickel trading for the first time since 1988, and canceled US$3.9 billion worth of trades to liberate bearish traders and their brokers from huge margin calls.
Source : Bloomberg & London Metal Exchange (LME)
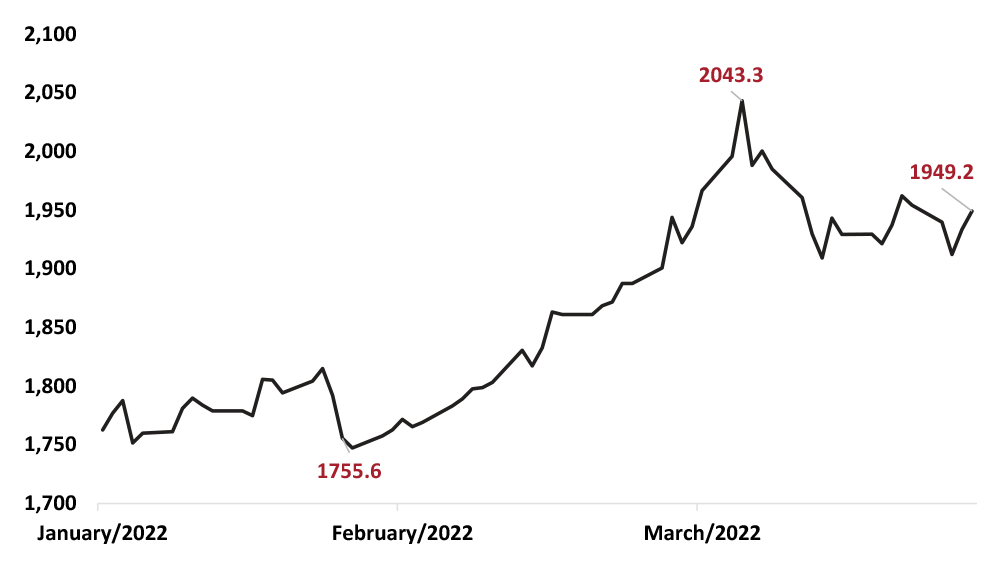
CRUDE PALM OIL
FCPO 2022 YTD CHART
MYR / metric tonne
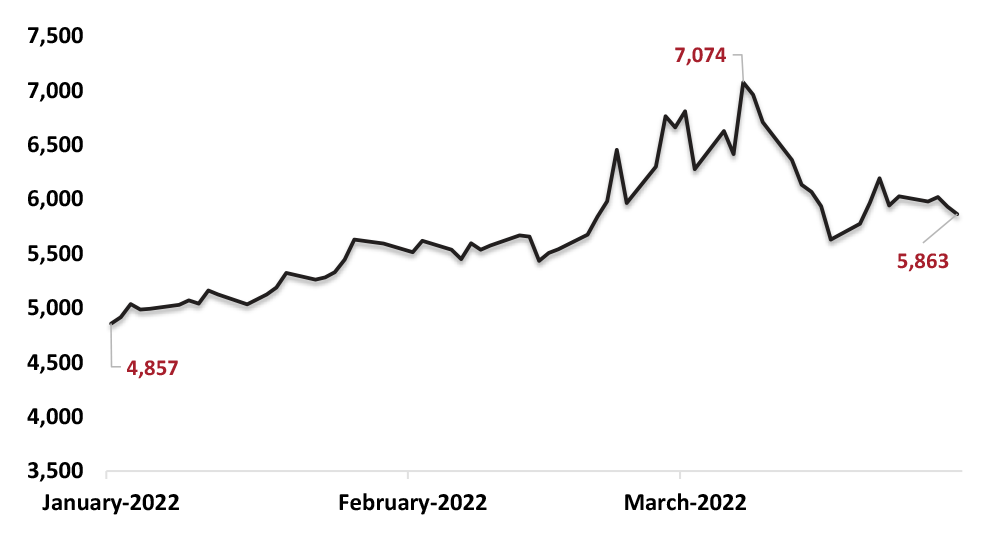
Palm oil market began Q1 2022 in a moderately high note driven by shortages in supply caused by flash flood and labour shortages in second-biggest palm oil grower in Malaysia, Sarawak state. Futures on crude palm oil (FCPO) broke through the US$1,168 (MYR 5,000) per metric tonne level on 10th January. This trend is driven by stronger soybean oil and petroleum prices, weather concerns in South America affecting Soybean crops, scarcity in supplies from top producer Indonesia as well as, surging demand from India for tropical oil. February 2022 saw FCPO rising to become the front-runner among the 4 major internationally traded edible oils as buyers rush to secure replacements for sunflower oil shipments due to the months long tension in the Black Sea region.
Indonesia has expanded its Domestic Market Obligation (DMO) regulation in which it has imposed higher export levy and duty on all palm/palm kernel related exports in Feb 2022. This has caused key palm oil consuming countries to turned to Malaysia to meet demand.
Prices has receded from its peak of US$1,643 (MYR 7,074) per tonne as the scorching prices has slowed palm oil imports by top consumers such as India and China. According to Malaysian Palm Oil Council in China, China’s palm oil imports are expected to be flat at 6.7 million tonnes in 2022, compared to 6.63 million tonnes in the year before. Fitch Ratings is expecting a gradual tapering in crude palm oil prices moving forward due to expectations of higher output over the next year.
Source : Bloomberg, CNA, S&P Global
MOVING FORWARD
H2 2022

Source : Gerson Lehrman Group (GLG), Bloomberg, United Nations’ Intergovernmental Panel on Climate Change (IPCC),
Climate Change and Global Warming
Climate change is expected to affect the commodity market, particularly agricultural sector, by altering crop growing conditions and pest incidence. Meteorological extremes of unprecedented frequencies, intensities and duration can be seen as typical supply shifters that, on a par with economic and structural drivers, distort supply, demand, trade, and induce price variability.
La Niña, a cold event that occurs when stronger-than-usual trade winds causes warm water to accumulate over Asia, is impacting not only crops production, but also natural gas prices. The year 1996 had a major U.S. drought for Plains wheat, while 2008 had a cool spring and planting delays for U.S. corn. The last time agricultural commodity prices were this high was in 2012, after two consecutive La Niña events (between mid-2010 and mid-2012).
From drought in Kansas, through maximum temperature in Canada, to flashfloods in parts of Europe, these extreme weather events have exposed millions of people to acute food and water insecurity. China, for example. Rising global temperatures, compounded by geopolitical turmoil and the pandemic, is hindering China’s effort to ensure food supplies for its 1.4 billion population. The soaring demand has pushed imports of corn, soybeans and wheat to record levels, making Beijing increasingly vulnerable to trade tensions and supply shocks. At the same time, climate change-induced disasters have caused widespread crop damage and shrunk the amount of arable land, making it harder to boost local production.

Source : Schroders . S&P Global, World Economic Forum, UNEP.org, ADGM.com
Renewable Energy’s and Zero Carbon Driven Demand
UN’s Global Roadmap sets out milestones the world must reach to achieve net-zero emissions by 2050, with no new coal power plans after 2021 and US$35 billion annual investment in access to electricity by 2025. UN-Convened Net Zero Asset Owner Alliance (Oct 2021) highlighted its member investors commitment to reduce portfolio emissions by 25-30% by 2025 across listed equity, corporate bonds, and real estate.
Producers, policy makers and investors commitment on net-zero goals has led to “greenflation”, a term that defines sharp rise in prices of materials used in the creation of renewable technologies. Tension between decarbonizing power grids and ensuring reliable/affordable power supply are driving the expansion in the range of clean energy technologies. Attention will likely continue to grow in 2022 on alternatives like battery energy storage systems, offshore wind, low-carbon hydrogen, carbon capture and storage (CCS), and nuclear.
Abu Dhabi has created a carbon trading exchange and clearing house (ACX) in March 2022, to facilitate trading and financing of carbon credits. About $50 trillion in incremental investments is required by 2050 to achieve net-zero goals and cut greenhouse emissions by about 51 billion tonnes a year.

Source : Schroders
Impact of rising rates
Possibility of further interest rates hike from the US and other developing economies to combat rising inflation pressure. Although technically base effects may lead to inflation peaking later this year, central banks around the world are acutely aware that they are behind the curve and are moving to tighten monetary policy.
While the last 10 years have been characterised by tight fiscal policy and loose monetary policy, this status quo is set for a turnaround. With a more interventionist approach from the governments being accelerated by the pandemic and geopolitical conflict, we are seeing a return to looser fiscal policy and tighter monetary policy.
Download full article here
Disclaimer:
This document has been prepared solely for the use of the recipient. No part of this publication may be reproduced, stored in a retrieval system, or transmitted in any form or by any means without the prior written permission from Kenanga Futures Sdn Bhd. Although care has been taken to ensure the accuracy of the information contained herein, Kenanga Futures Sdn Bhd does not warrant or represent expressly or impliedly as to the accuracy or completeness of the information. This information does not constitute financial or trading advice; neither does it make any recommendation regarding product(s) mentioned herein. Kenanga Futures Sdn Bhd does not accept any liability for any trading and financial decisions of the reader or third party on the basis of this information. All applicable laws, rules, and regulations, from local and foreign authorities, must be adhered to when accessing and trading on the respective markets.
Risk Disclosure:
Trading in contracts involves the risk of loss greater than your initial investment. This brief statement does not disclose all of the risks and other significant aspects of trading in contracts. In light of the risks, you should undertake such transactions only if you understand the nature of the contracts (and contractual relationships) into which you are entering and the extent of your exposure to risk. Trading in contracts is not suitable for many members of the public. You should carefully consider whether trading is appropriate for you in light of your experience, objectives, financial resources and other relevant circumstances.
For a full statement on risk disclosure, please refer to this link https://www.kenangafutures.com.my/wp-content/uploads/2020/09/RISK-DISCLOSURE-STATEMENT.pdf