Understanding Technical Analysis : Bollinger Bands

Understanding Bollinger Bands
Bollinger bands are a type of technical indicator developed by a seasoned technician named John Bollinger to measure market volatility. Many traders or analysts will use Bollinger bands to measure the “lowness” or “highness” of the financial instrument’s price, relative to previous trades.
How to Calculate Bollinger Band
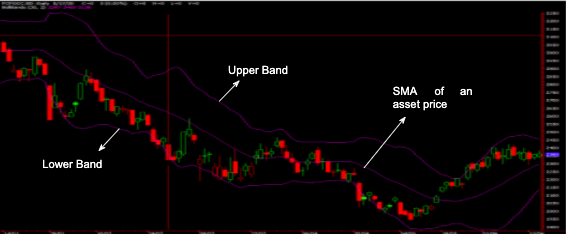
Bollinger bands are calculated using three lines that consist of the Simple Moving Average (SMA) of an asset price, upper band and lower band. Both upper and lower bands are plotted two standard deviations away from the SMA of an asset price.
1) The SMA of an asset price
= Closing prices for the number of days that we are looking at (normally 20 days)
total sum of all the closing prices by the total number of days
2) The Upper Band
= 20-day simple moving average + (20-day standard deviation multiplied by 2)
2) The Lower Band
= 20-day simple moving average – (20-day standard deviation multiplied by 2)
How to use Bollinger Bands?
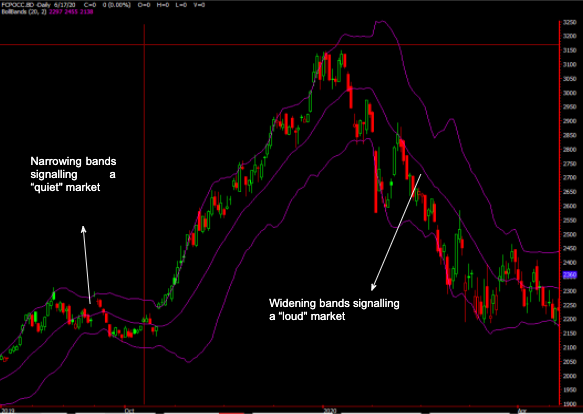
- Bollinger bands are used to measure the volatility of the price of the financial instrument.
- In other words, they are used to gauge the “loudness” of the market by observing the wideness of the band.
- If the bands are wider, it means that a market is more volatile or ‘loud”; while narrower bands mean that a market is more stable or “quiet”.
Bollinger Bounce vs Bollinger Squeeze
Apart from telling the traders on the “loudness” of the market, Bollinger bands can also tell traders on the potential direction of financial instrument. There are two techniques every traders can use in determining future price movement.
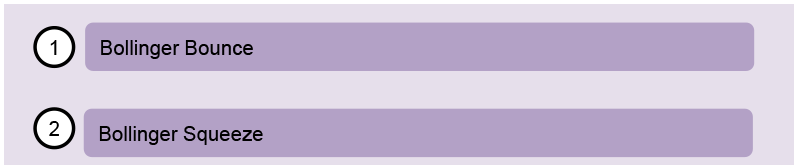
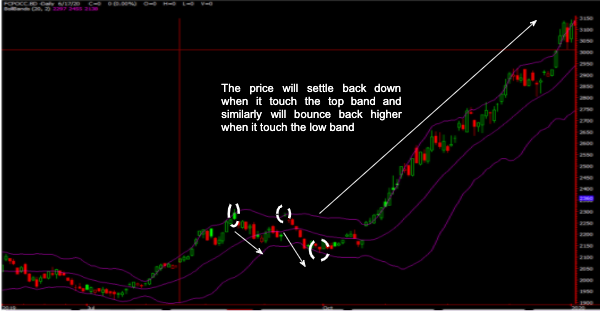
Bollinger Bounce
Under certain circumstances, Bollinger bands act like a trampoline. Whenever an object hits the trampoline, the object will bounce back higher. That is the idea of the Bollinger bounce. Under this technique, whenever the price touches the top band, the price will settle back down the middle area of the bands. Similarly, if the price reaches the lower band, the price will bounce back to the middle area of the bands.
Bollinger Squeeze
The main idea of this technique is when the bands start to squeeze together, it usually signals a breakout is about to happen.
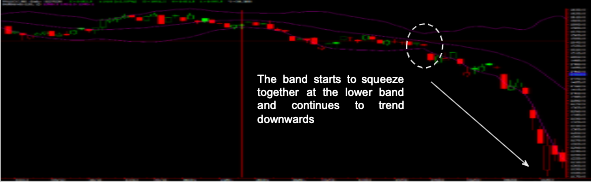
- If the price begins to break out of the top band, then the price usually continues to trend upwards.
- Similarly, if the price starts to break out of the lower band, then the price usually continues to trend downwards.
- This technique is beneficial for traders who would like to spot any trend changes.
Download full article here
Disclaimer:
This document has been prepared solely for the use of the recipient. No part of this publication may be reproduced, stored in a retrieval system, or transmitted in any form or by any means without the prior written permission from Kenanga Futures Sdn Bhd. Although care has been taken to ensure the accuracy of the information contained herein, Kenanga Futures Sdn Bhd does not warrant or represent expressly or impliedly as to the accuracy or completeness of the information. This information does not constitute financial or trading advice; neither does it make any recommendation regarding product(s) mentioned herein. Kenanga Futures Sdn Bhd does not accept any liability for any trading and financial decisions of the reader or third party on the basis of this information. All applicable laws, rules, and regulations, from local and foreign authorities, must be adhered to when accessing and trading on the respective markets.